Menu
September DC market snapshot listing new listings, under contract, and closed listings.

September 2021 Market Report

10/15/21  |  Rina Battiata Kunk

Market Snapshot for Washington, DC

September saw median home sale prices across all property types drop 4.7% compared to September of last year, with homes selling for a median price of $610,000. The median number of days from listing a home until a contract is ratified has increased 200%, increasing to 9 days. After becoming used to the red hot real estate market, 9 days feels like an eternity. Much of the overall decline can be attributed to the condo/co-op market, which is still trying to recover during the pandemic. There were 685 homes sold in September this year, down from 949 last year. Inventory continues to be a challenge with the number of active listings declining year-over-year. Source: BrightMLS. Sept 2020 - Sept 2021, Washington. DC


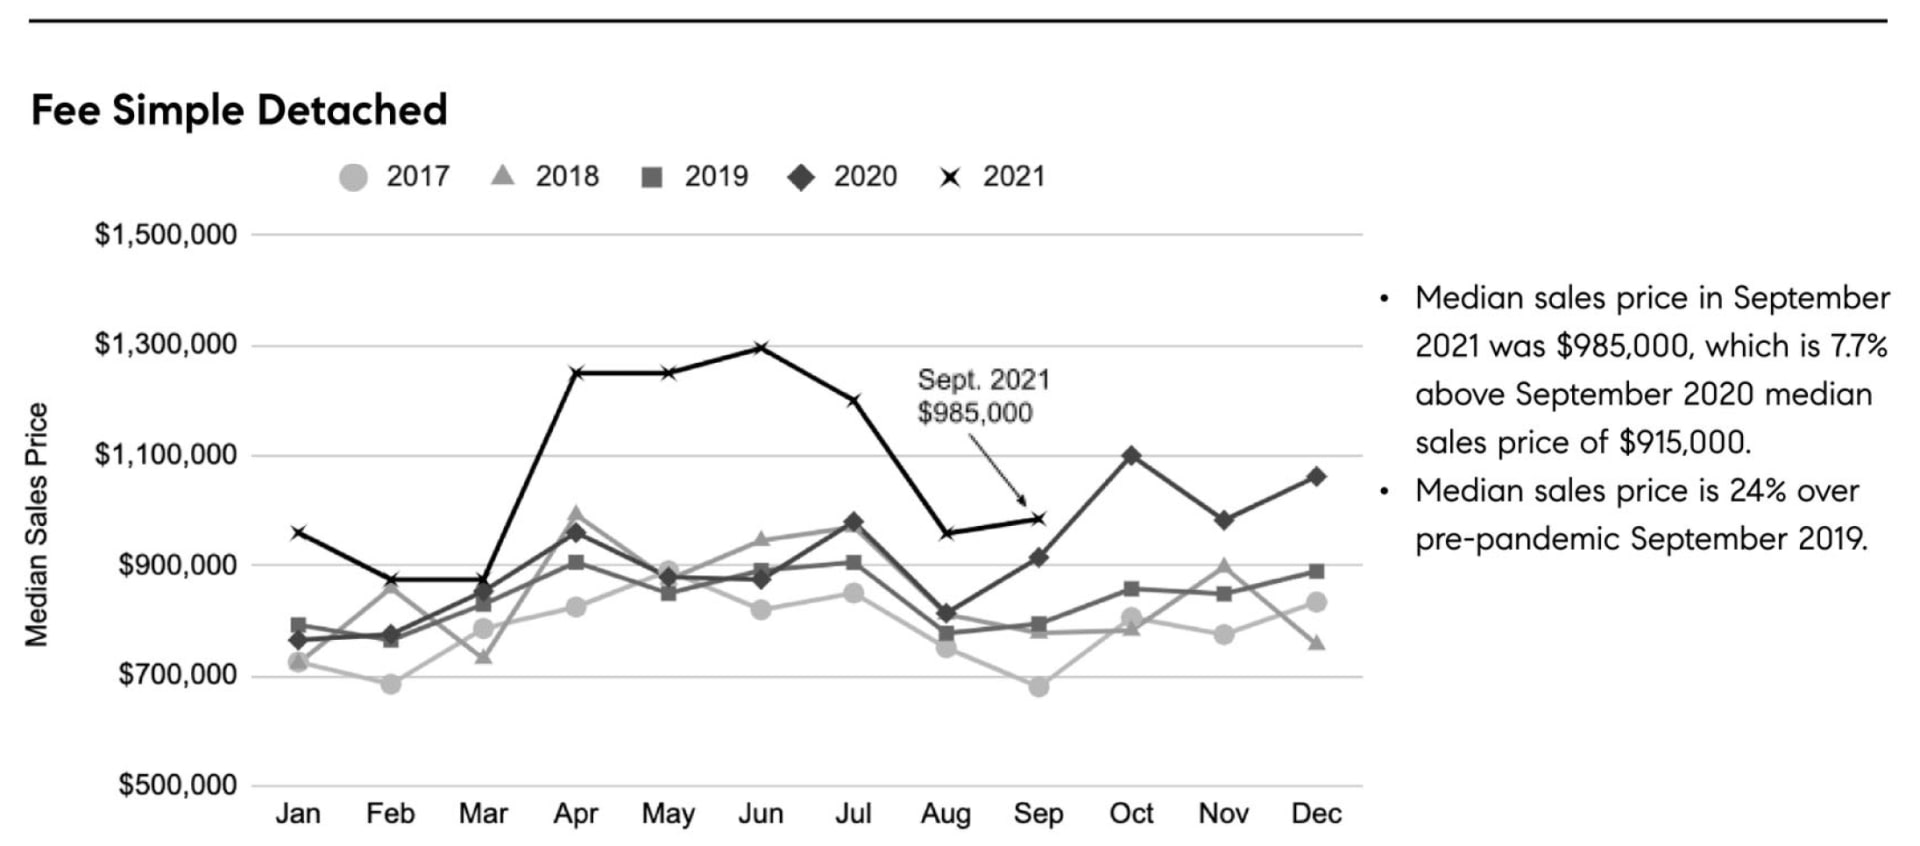
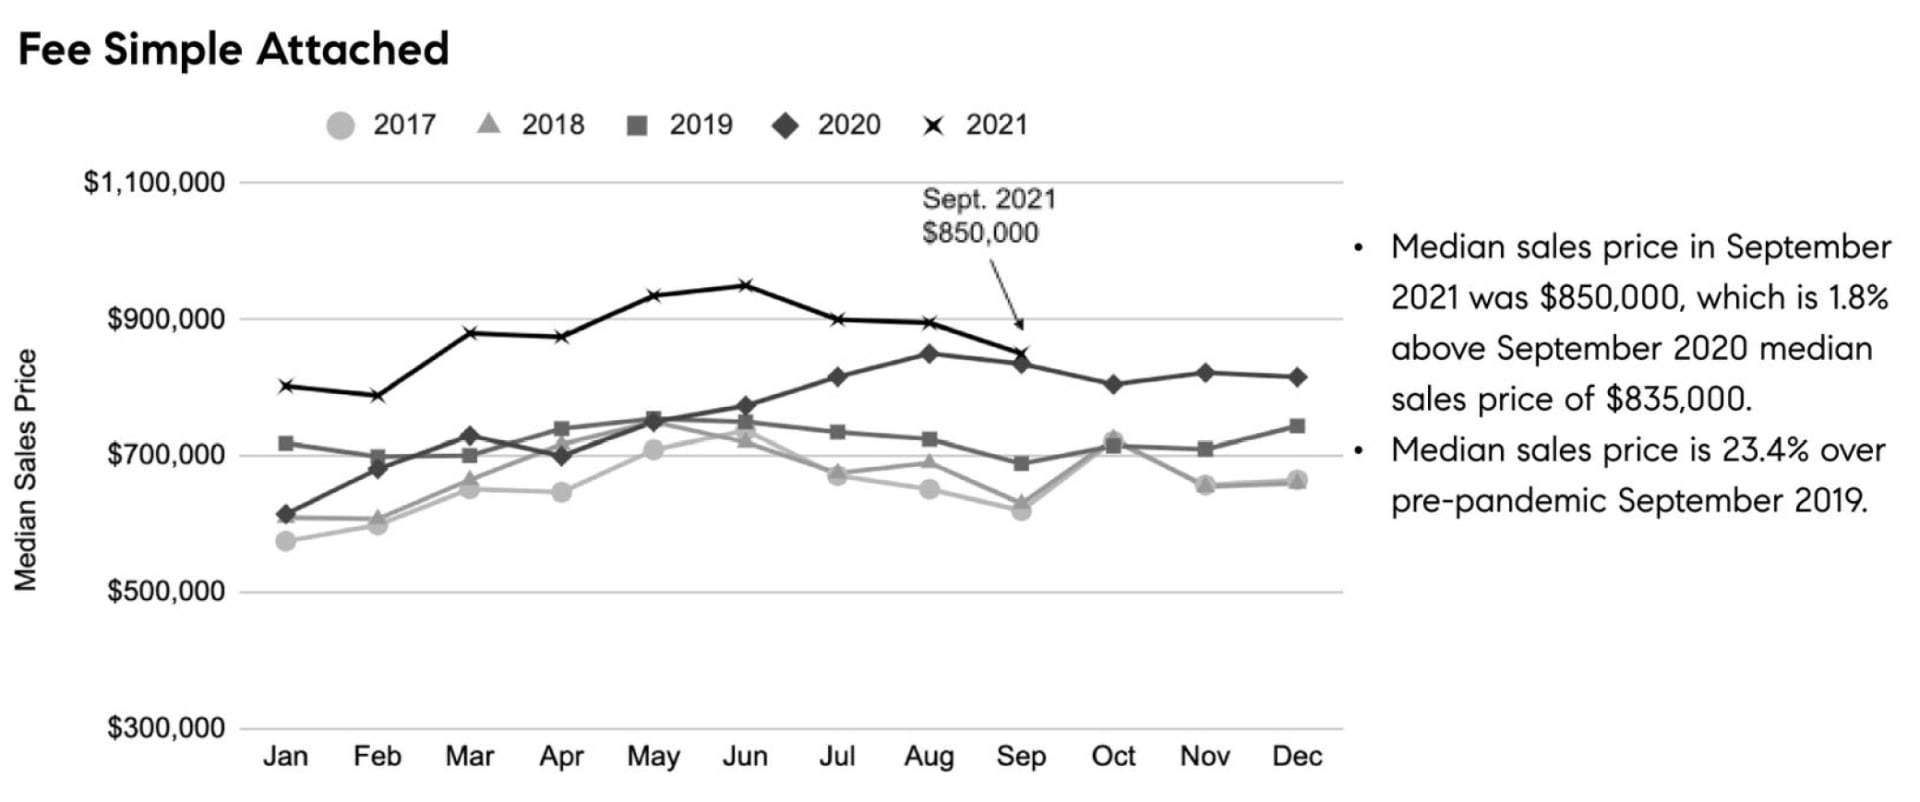
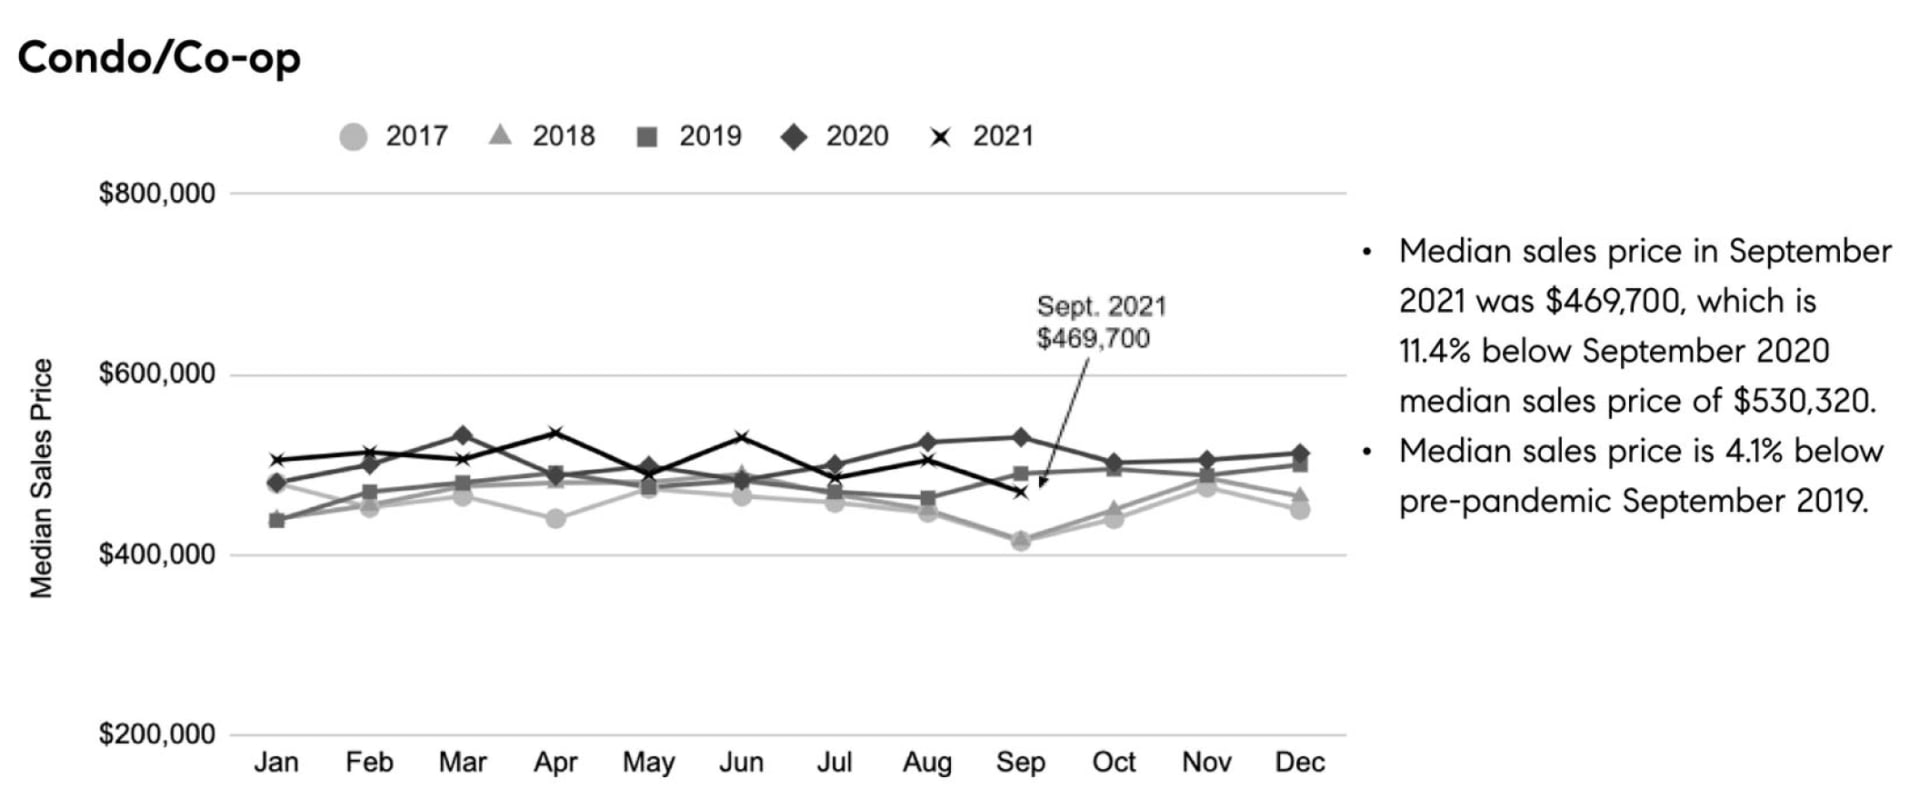
Median Sales Price (Washington, DC, 2017 - Current)

Line chart of monthly detached-home median sales prices, 2017–2021; September 2021: $985,000.


Line chart comparing monthly median sales prices from 2017 to 2021; September 2021 was $850,000.


Condo and co-op median sales price chart for 2017–2021, with September 2021 marked at $469,700.


Number of New Listings, New Sales, and Active Listings

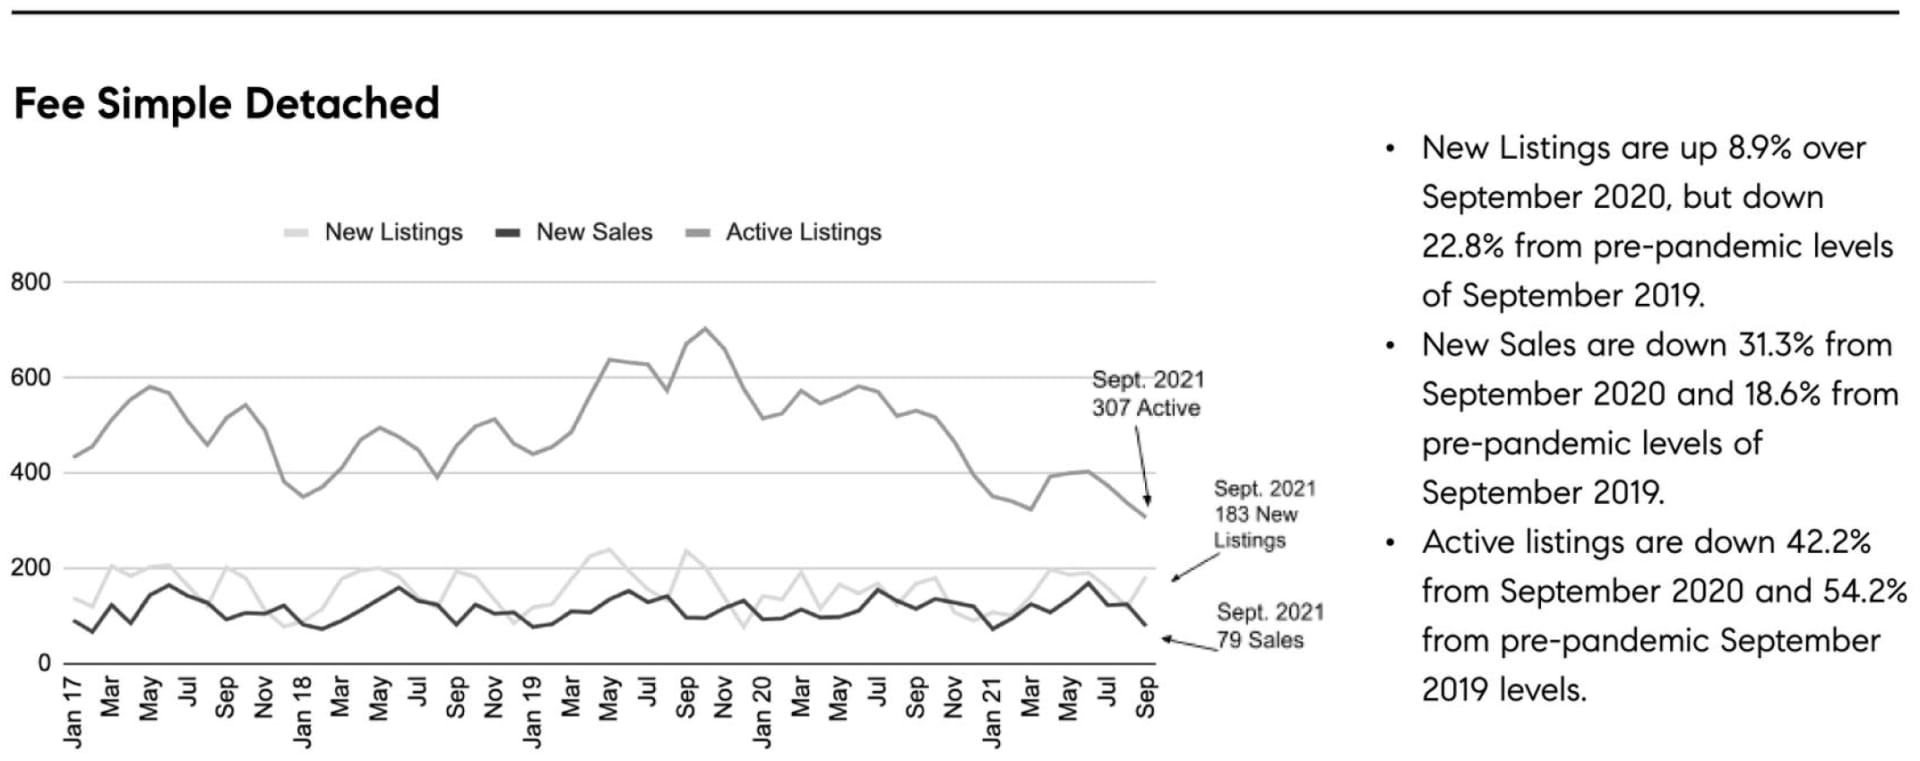
Fee simple detached market chart compares listings, sales, and active listings through September 2021.


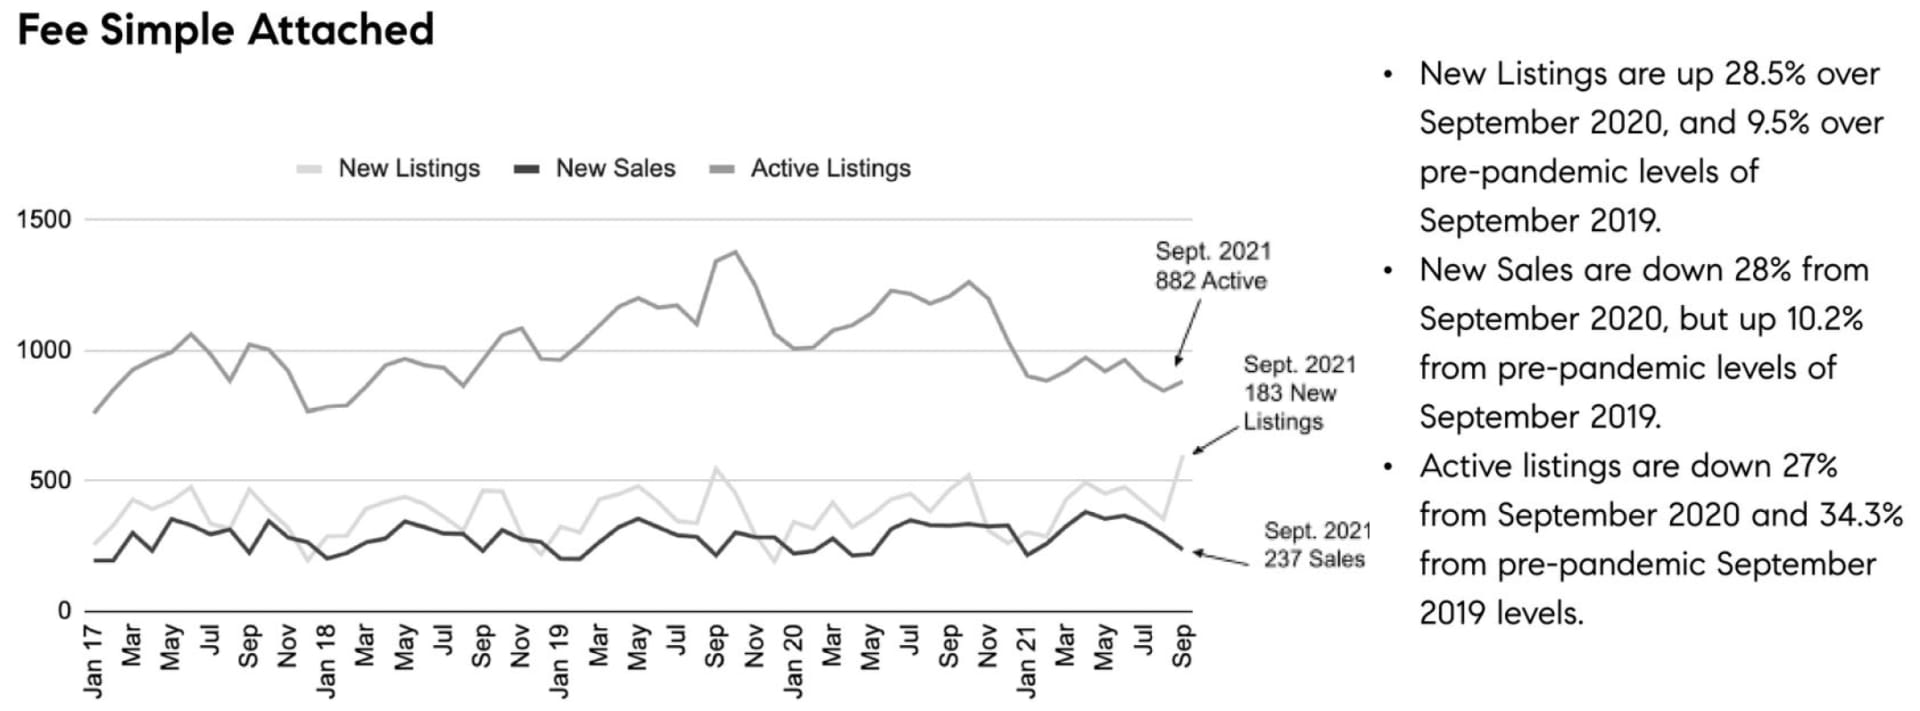
Line chart of new listings, sales, and active listings through September 2021, with market-change notes.


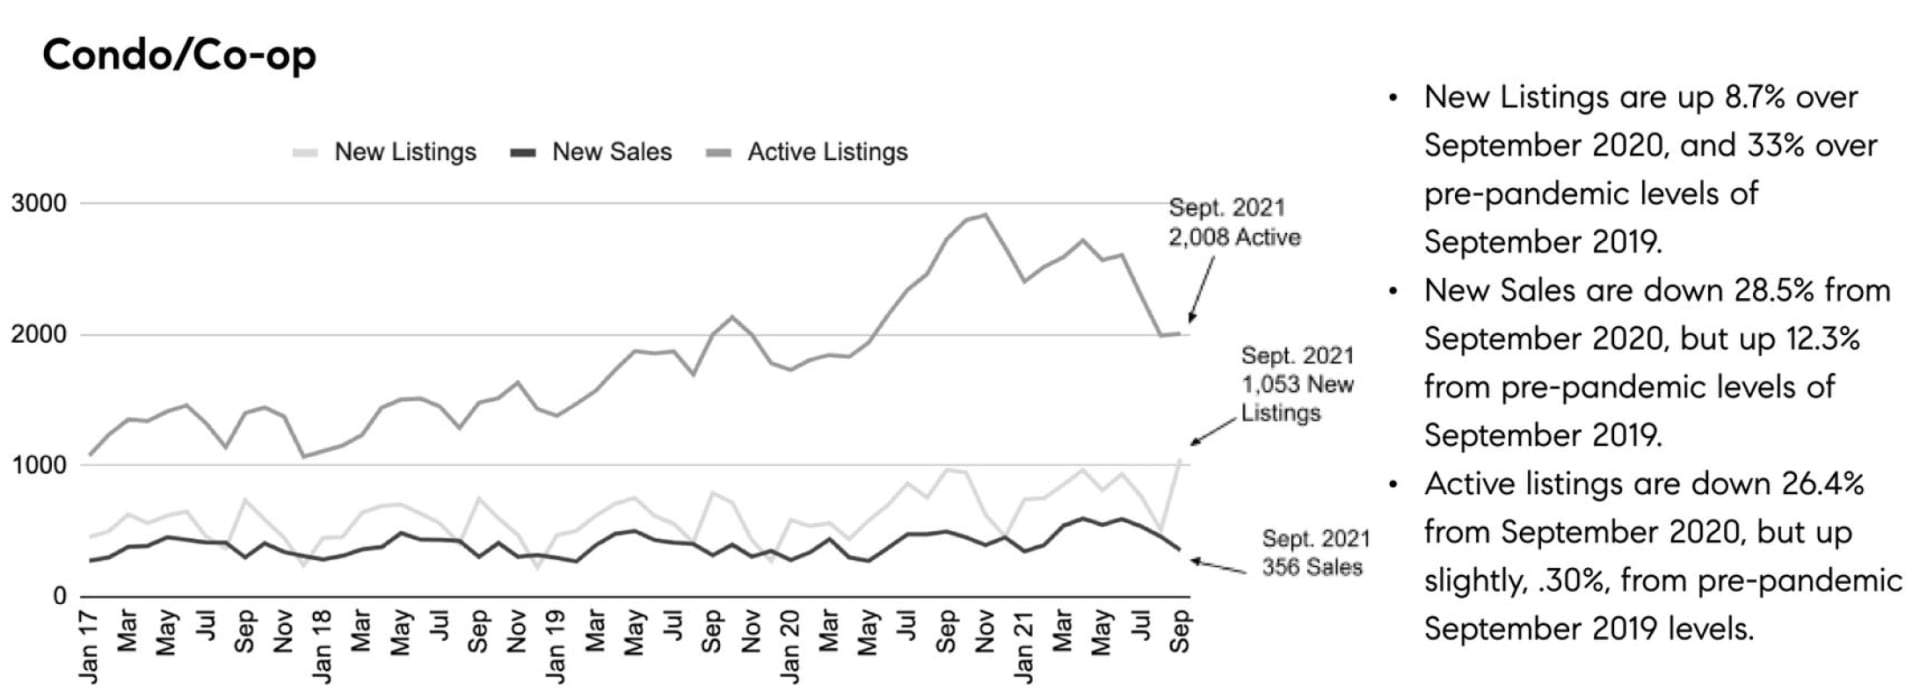
Condo and co-op market chart, January 2017–September 2021, with September 2021 listing, sales, and active inventory figures.


Median Number of Days on Market

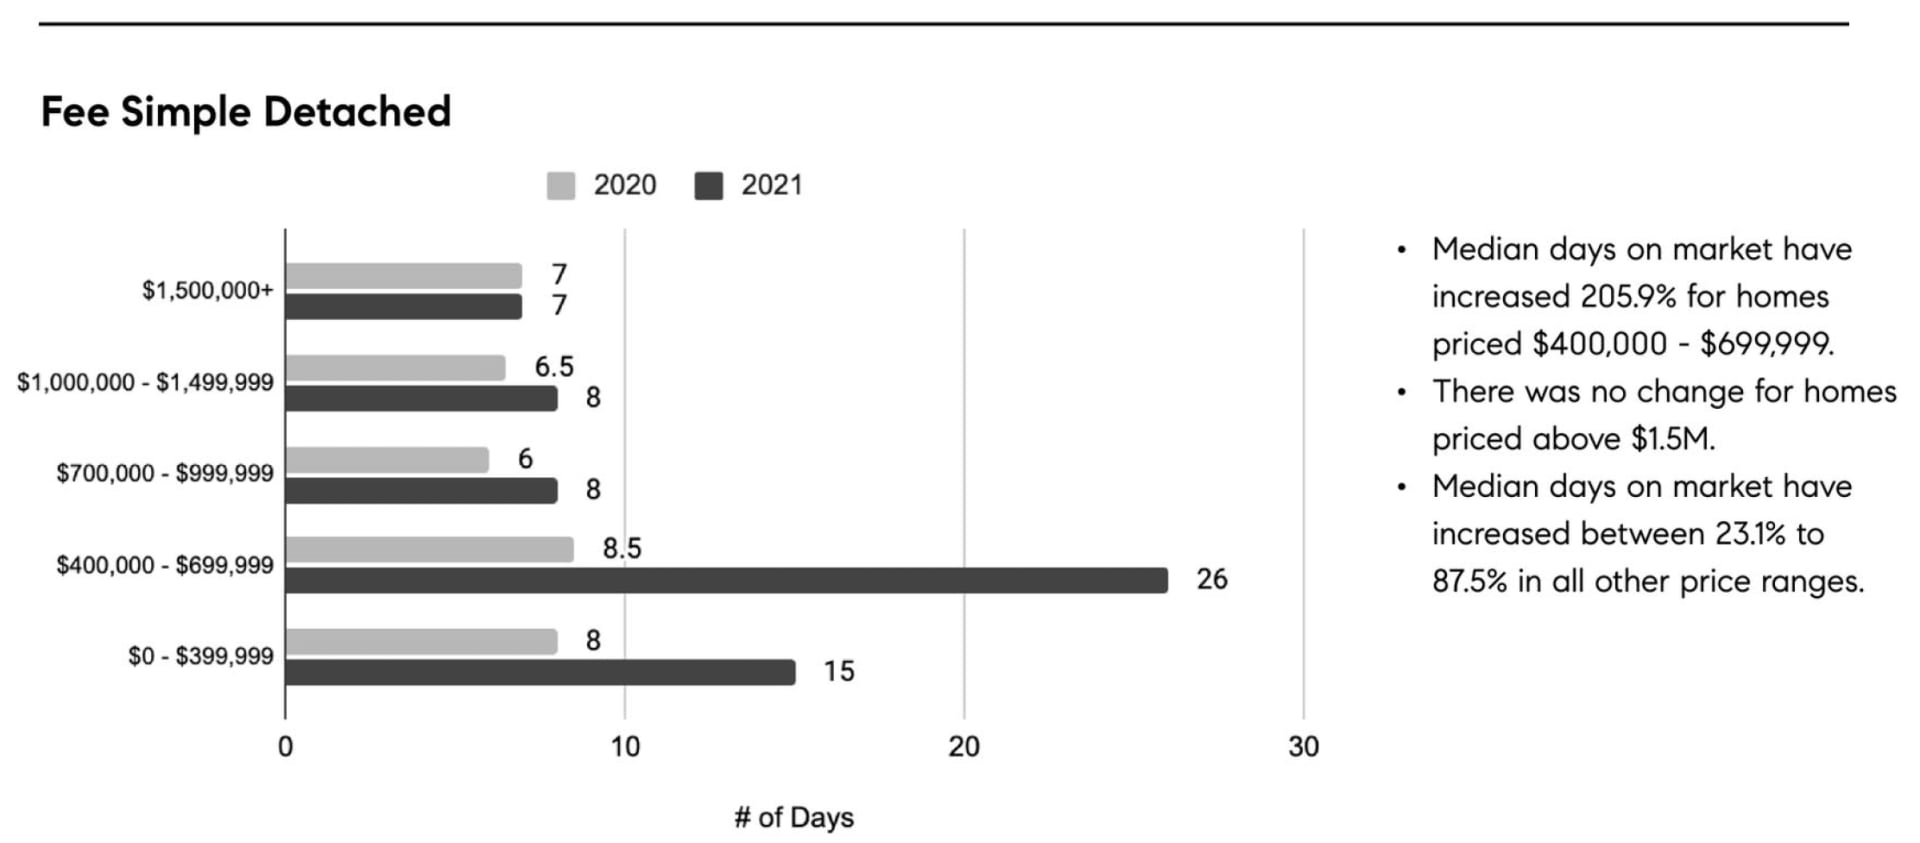
Bar chart comparing 2020 and 2021 days on market for detached homes across five price ranges.


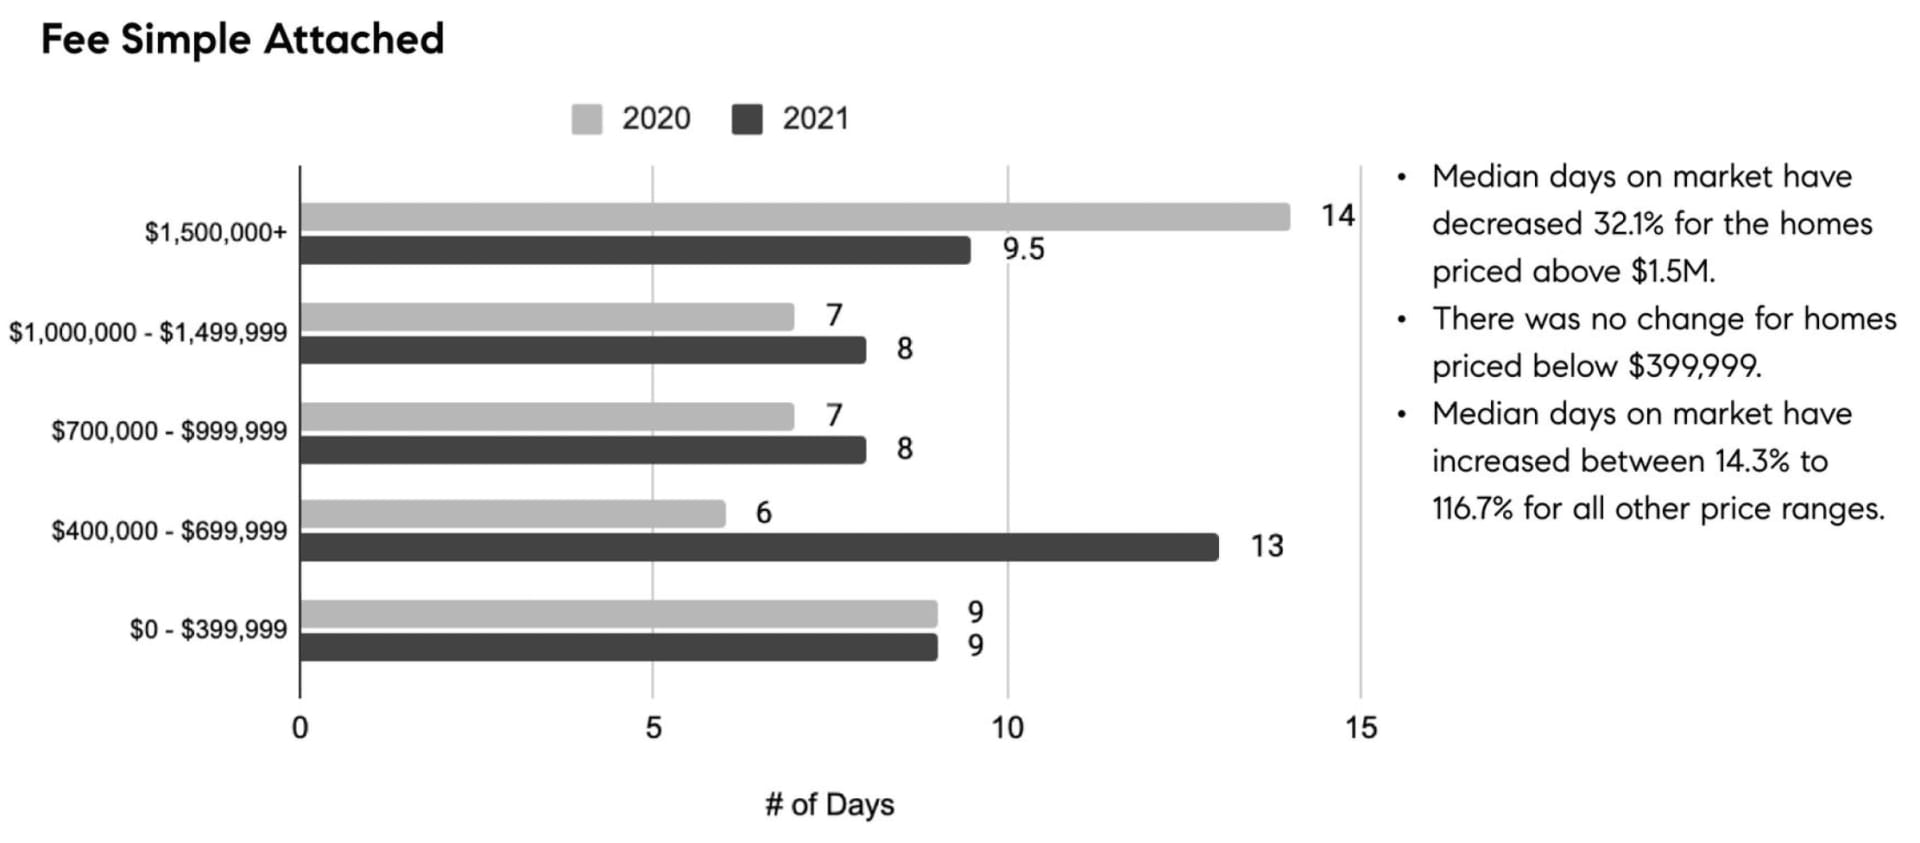
Fee Simple Attached chart comparing days on market by home price range in 2020 and 2021.


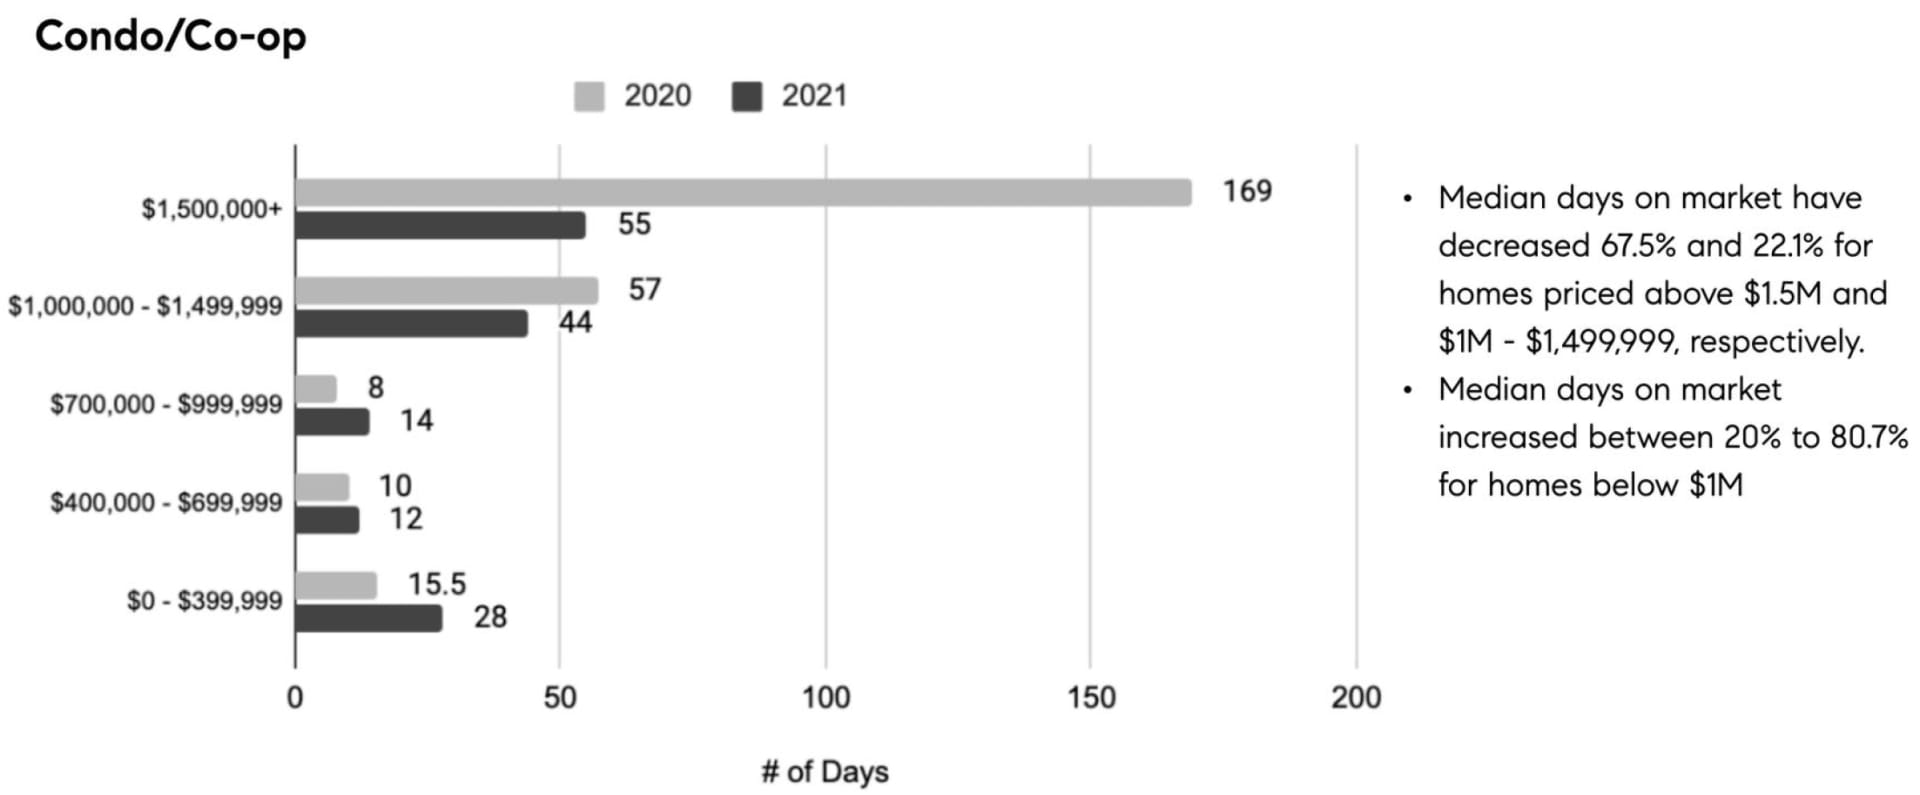
Bar chart comparing condo/co-op days on market by price range in 2020 and 2021.


New Contract Activity

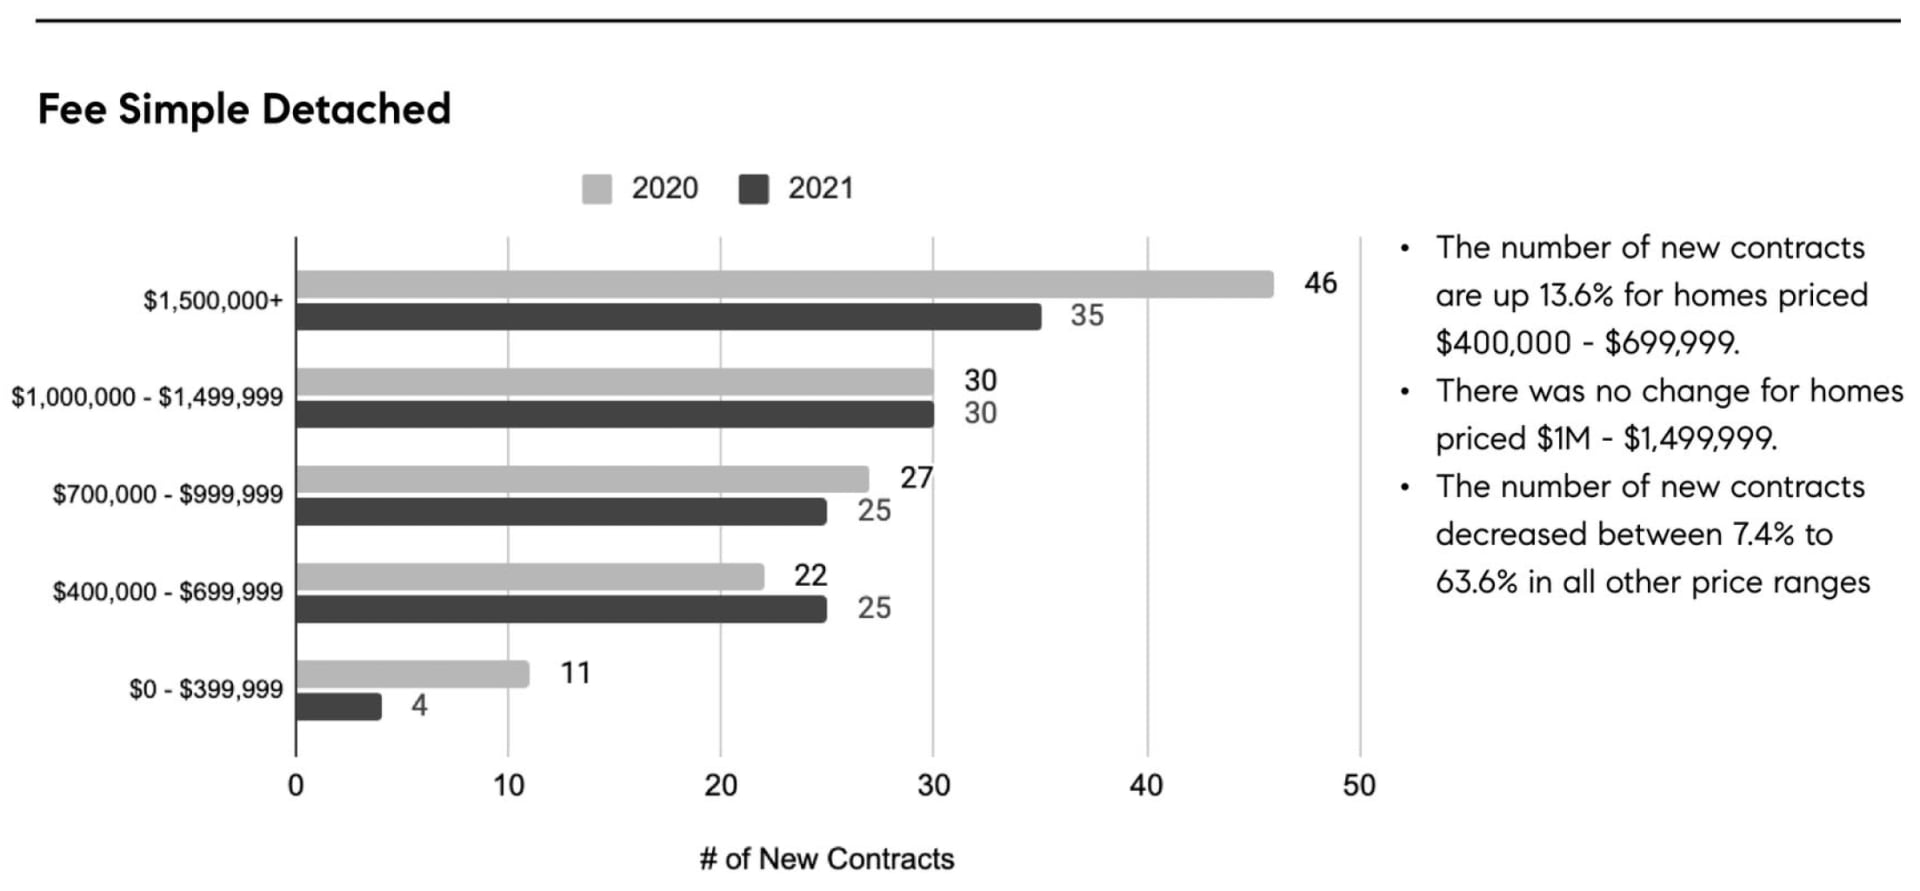
Fee Simple Detached contract chart: 2020 and 2021 counts by home price range, with increases only at $400,000–$699,999.


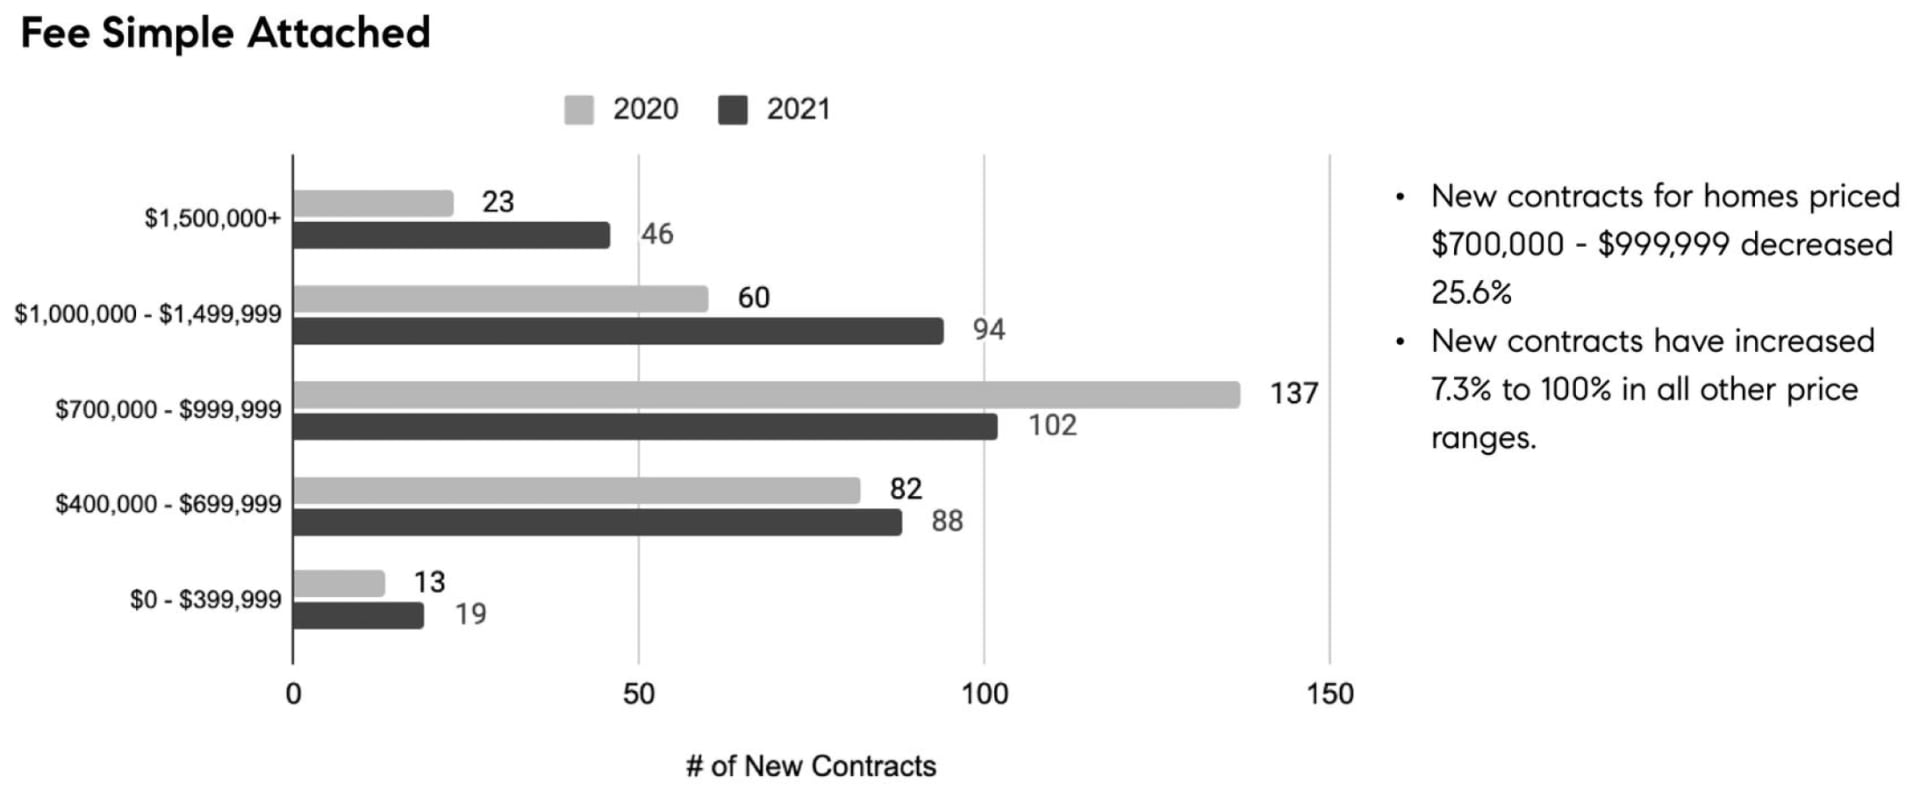
Bar chart comparing new home contracts by price range in 2020 and 2021.


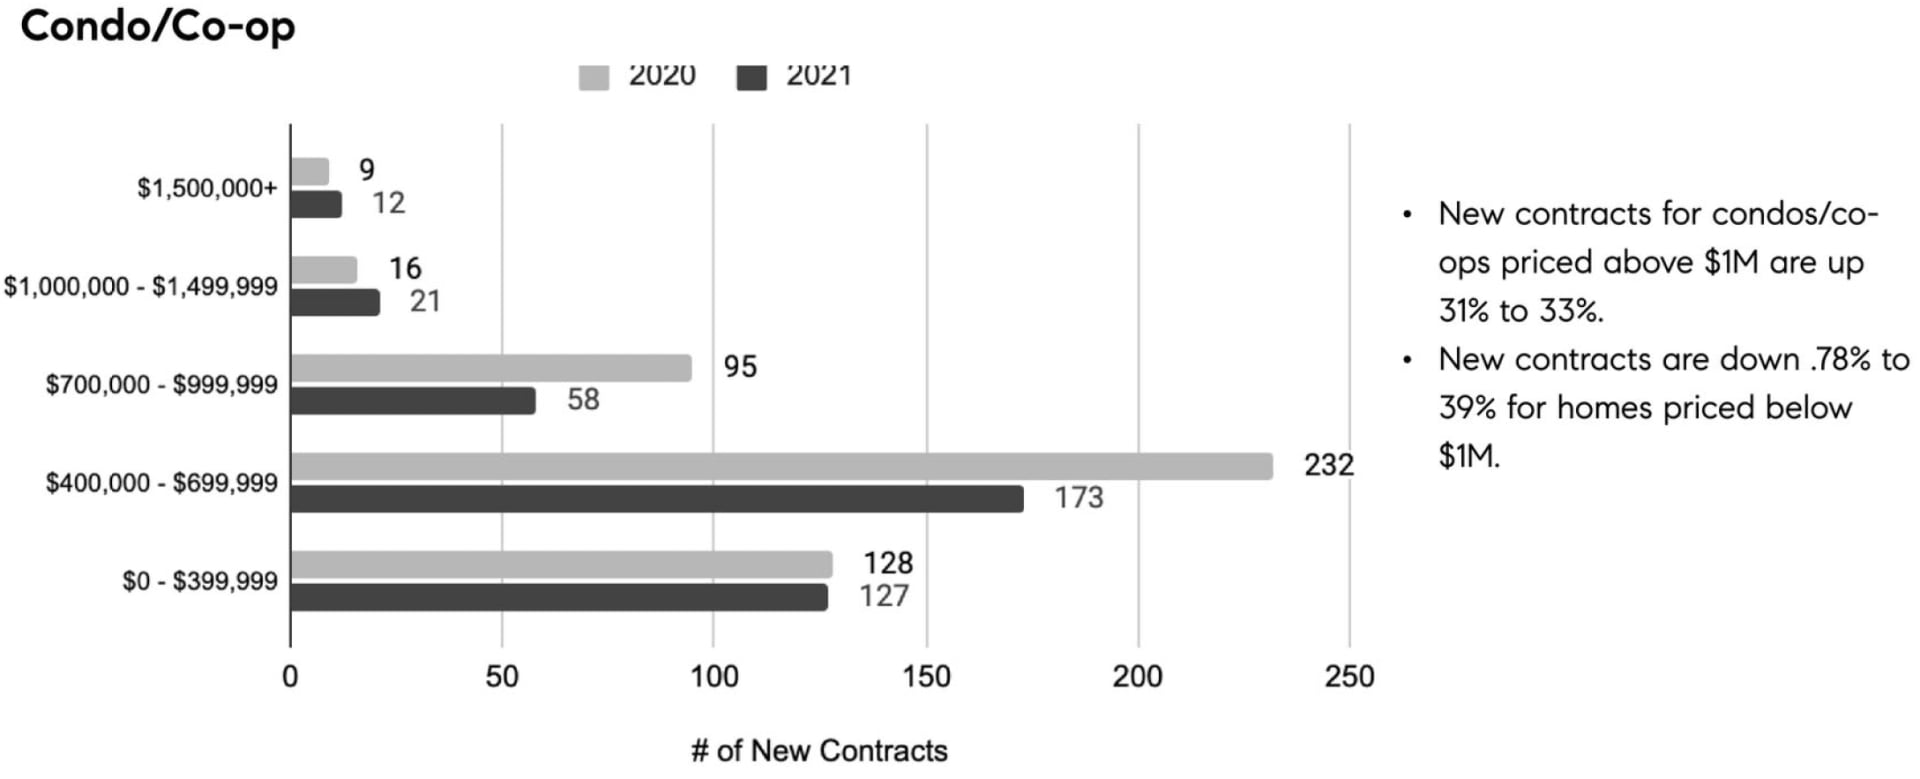
Chart comparing 2020 and 2021 new condo and co-op contracts across five price ranges.


New Listings

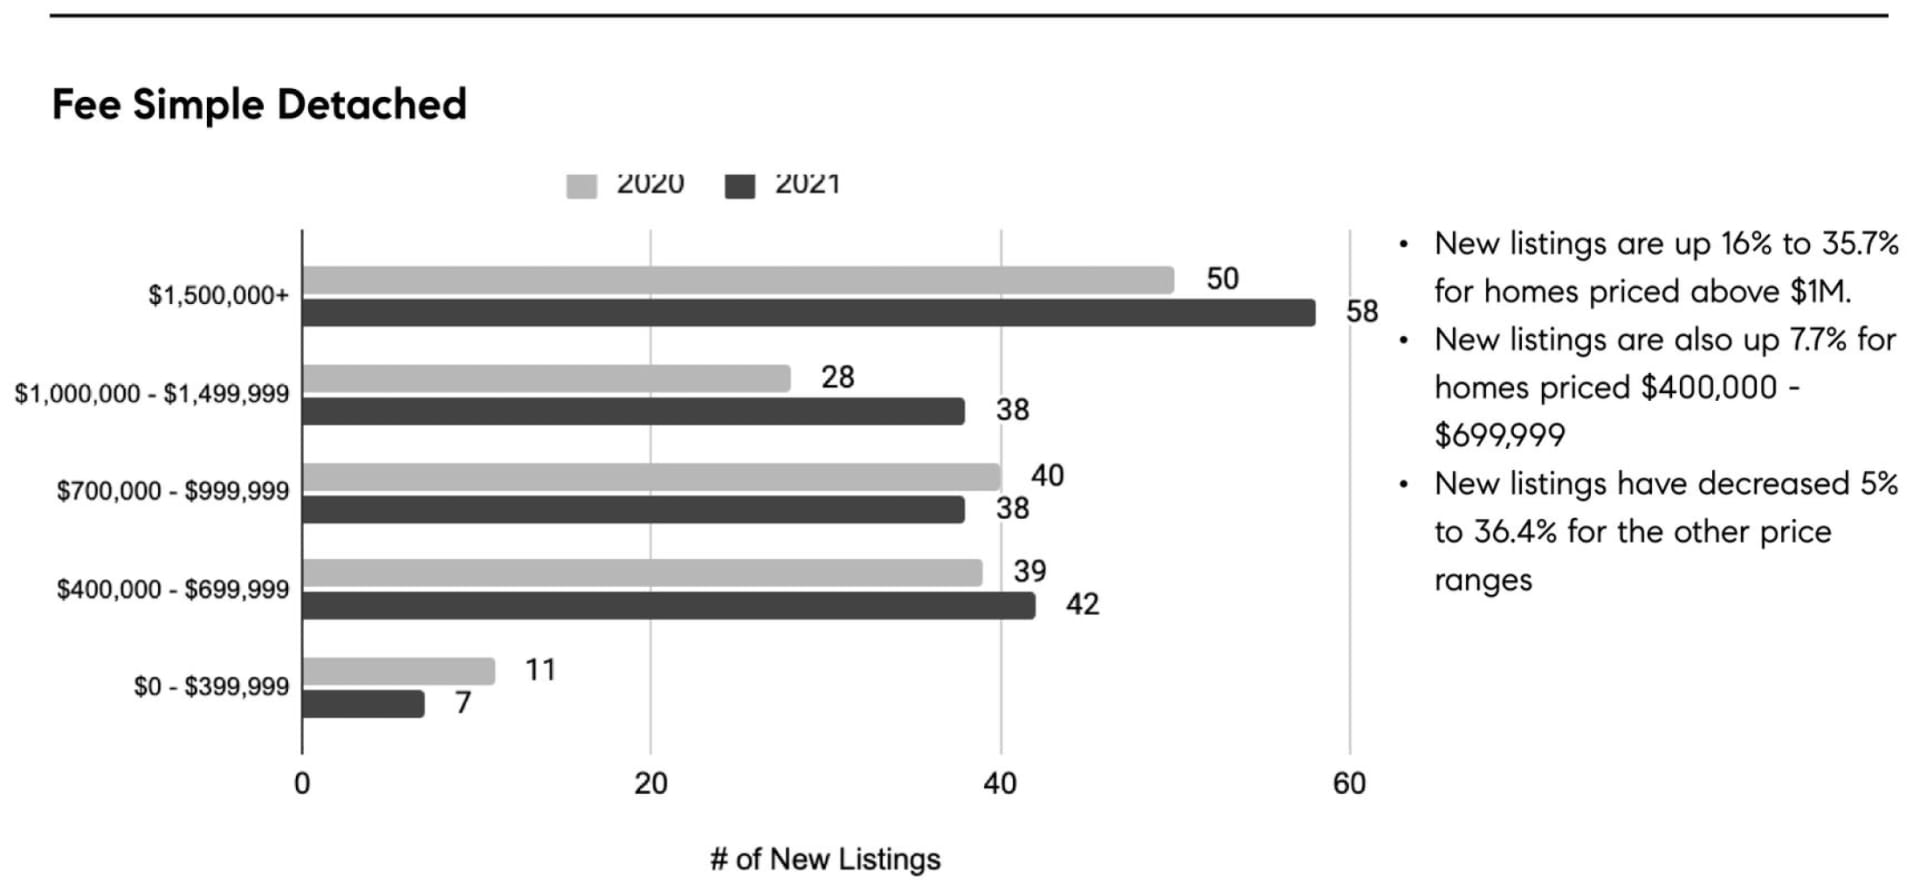
Fee Simple Detached chart compares new listings by price range in 2020 and 2021, with summary notes.


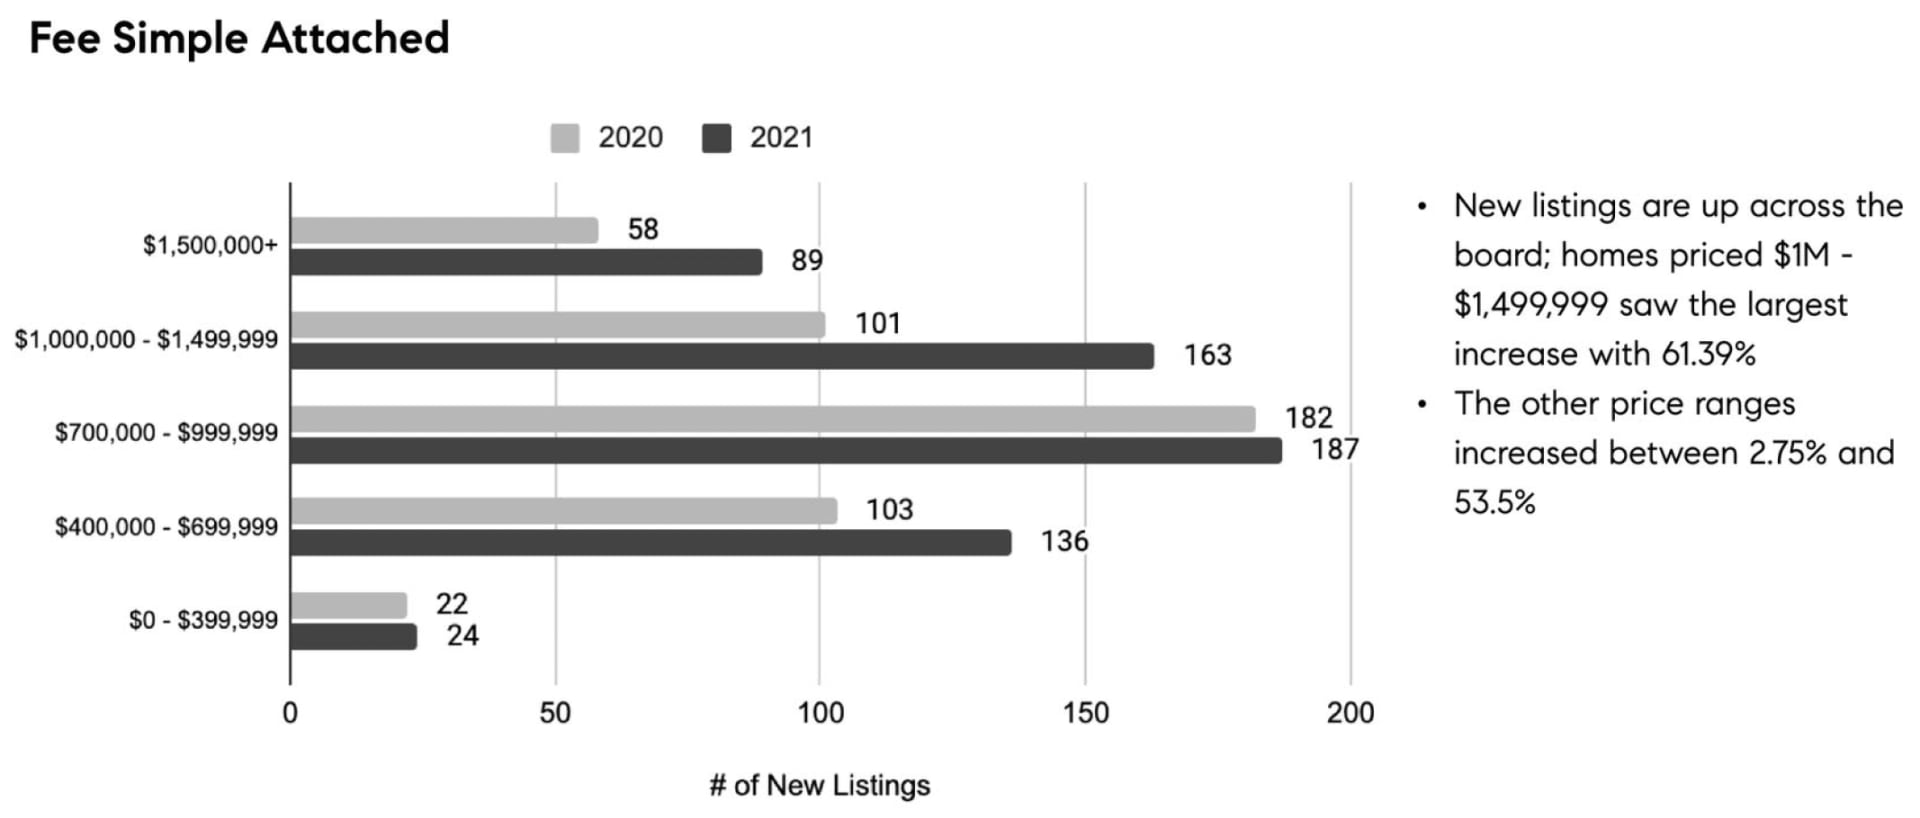
Fee Simple Attached new listings by price range, comparing 2020 and 2021; listings increased across all ranges.


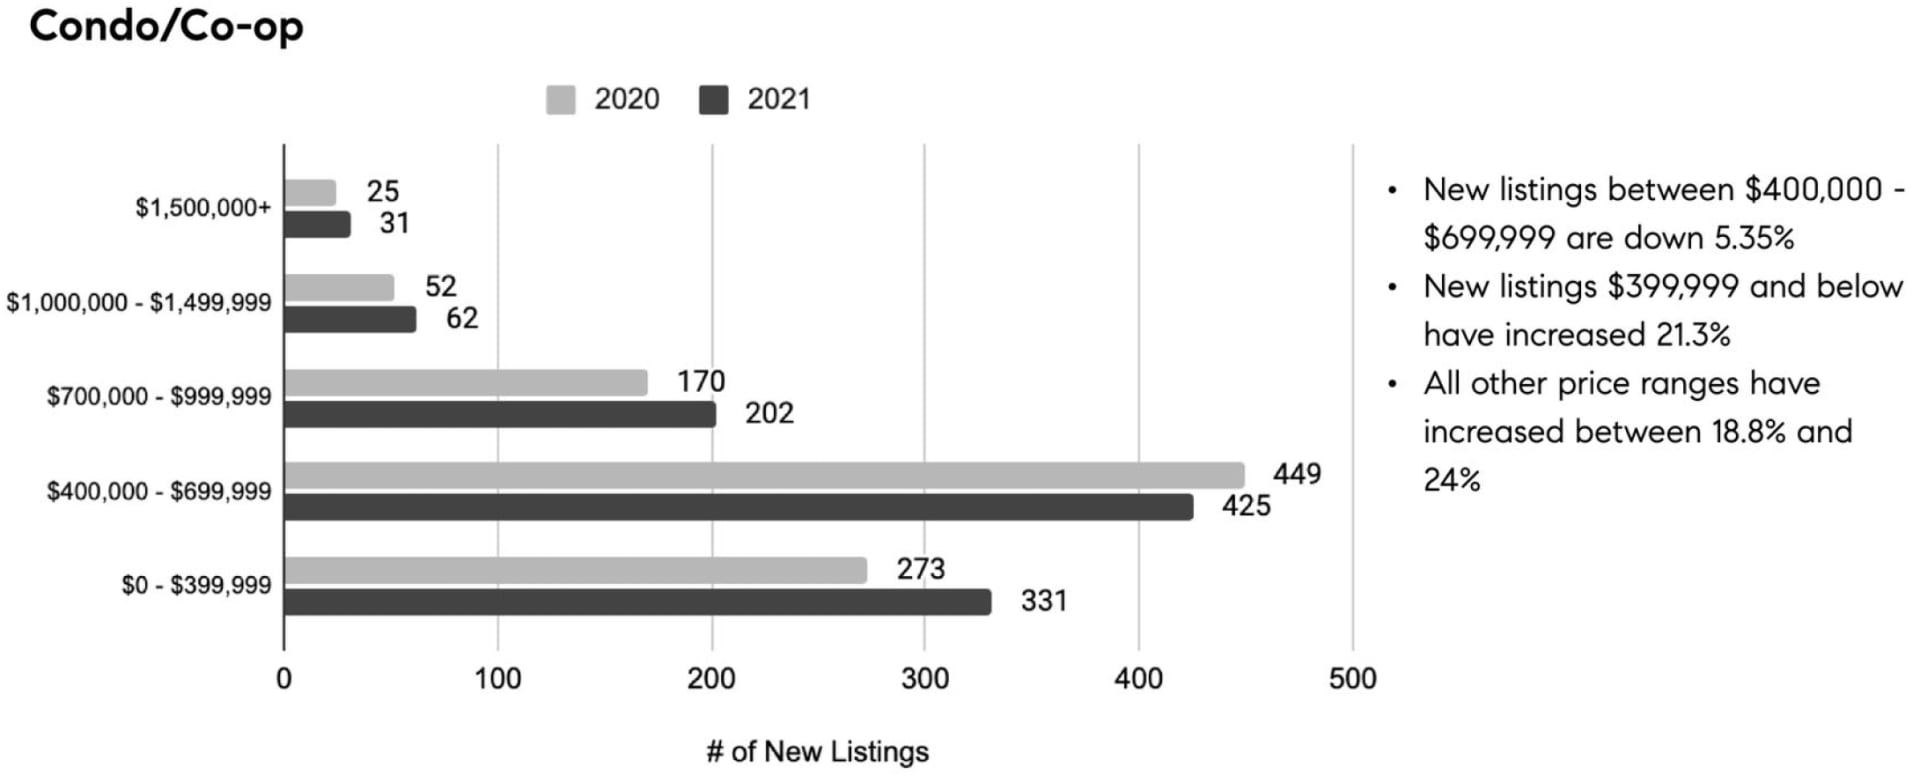
Condo/co-op new listings by price range, comparing 2020 and 2021 with percentage-change notes.


Work With Me

With the use of digital marketing, predictive analytics, social media targeting, email campaigns, and listing placements on prominent national websites as well as all local realtor websites, Rina leverages the full power of the internet to her client’s advantage.

Contact Me
Follow Us